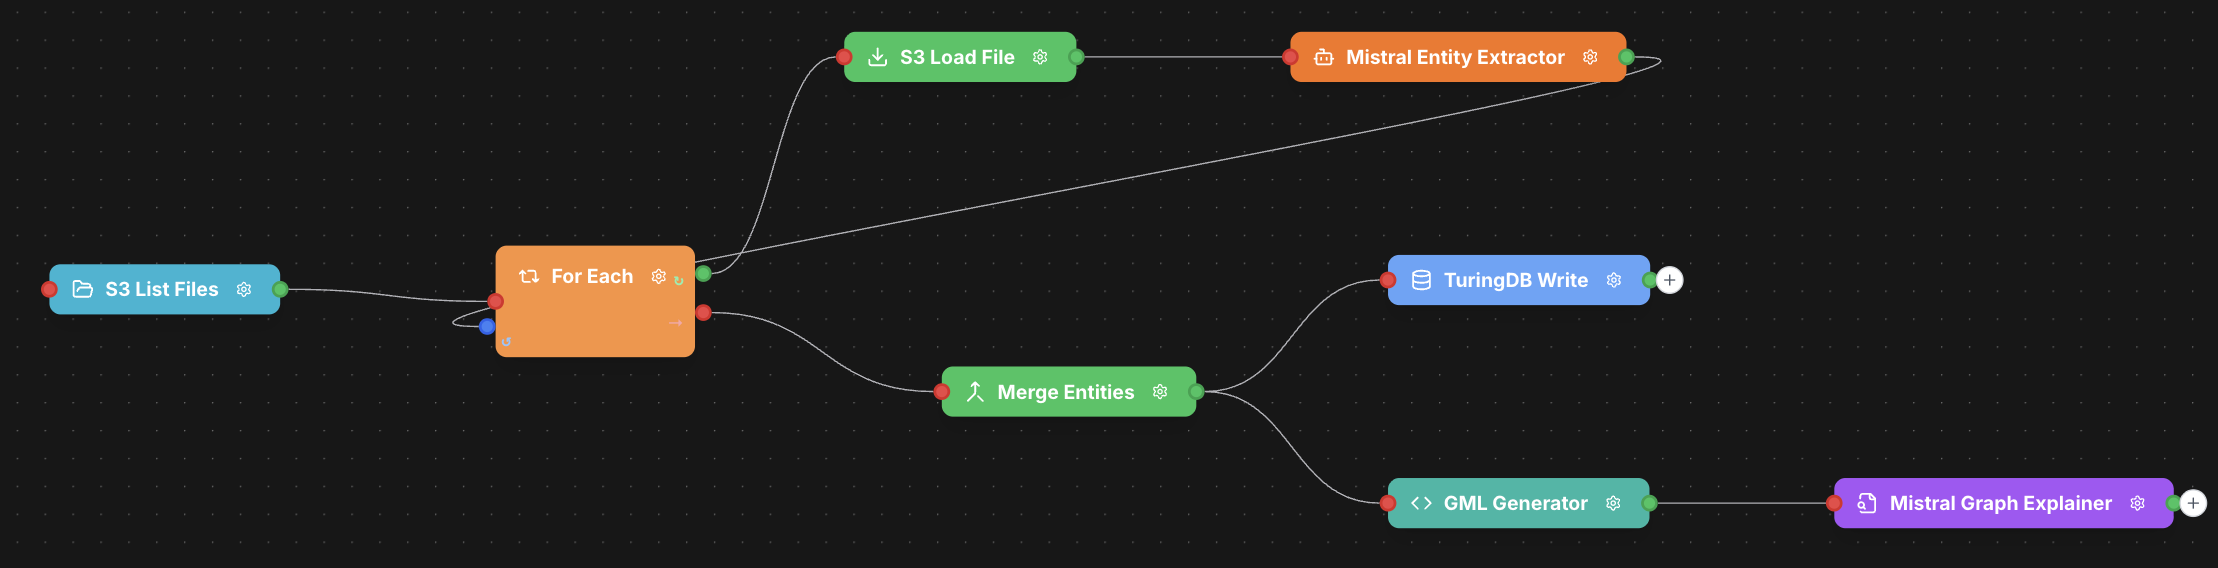
Workflow Overview
This workflow performs the following operations:- Lists files from S3 storage
- Iterates through each file using a ForEach loop
- Loads the file content
- Extracts entities using Mistral AI
- Merges all extracted entities
- Writes data to TuringDB
- Generates GML (Graph Modeling Language) output
- Creates an AI-powered summary of the graph
Step-by-Step Implementation
Step 1. Upload the clinical reports to S3
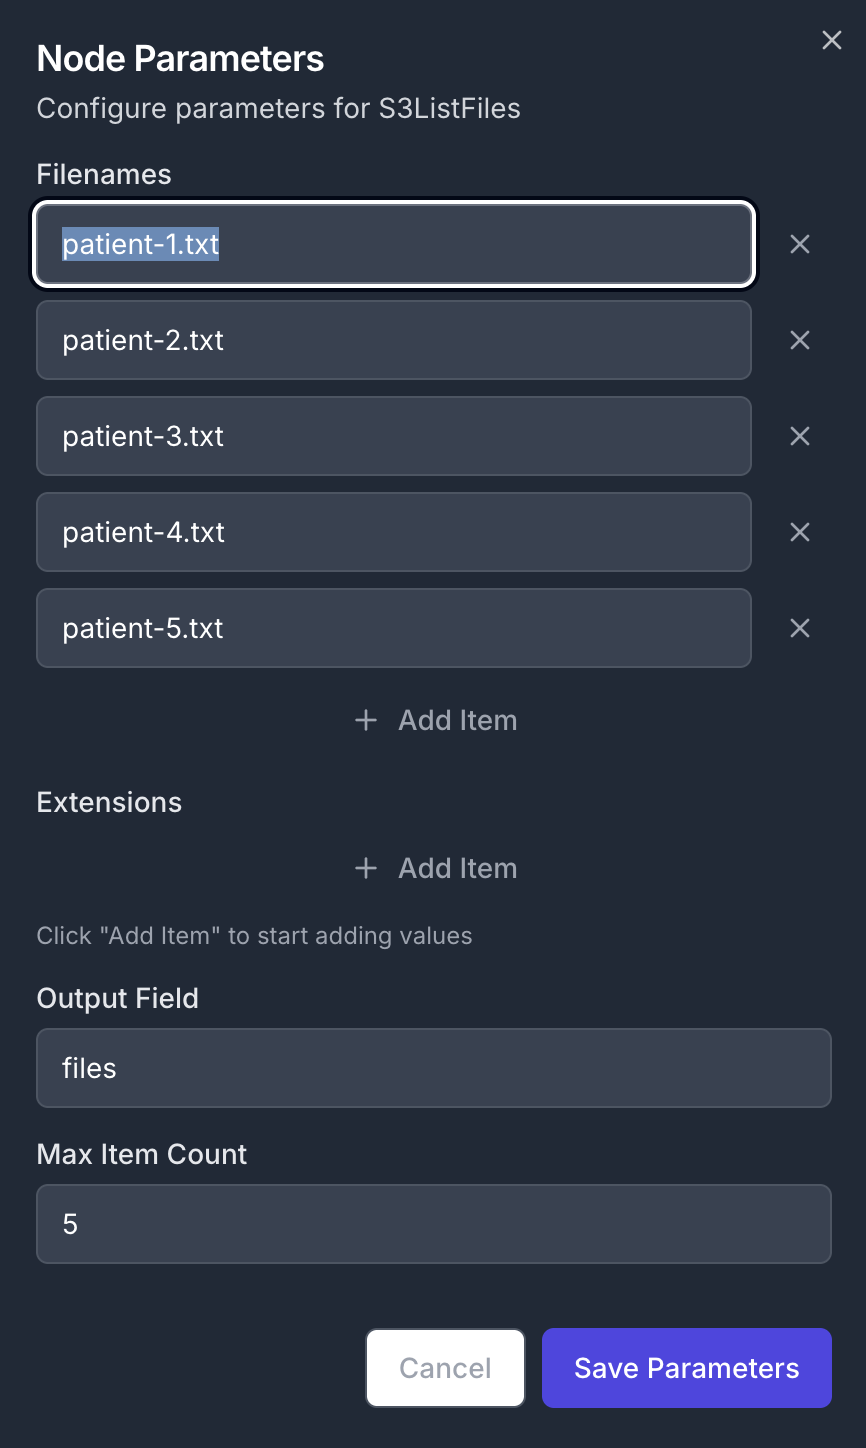
clinical-reports.zip First of all, download the example clinical reports, and upload them to your S3 data storageStep 2. Add an S3ListFiles node
Create a new workflow and add an S3ListFiles node as a first step. Node Configuration:- Parameters:
- Filenames: List of specific filenames to process
- Output Field:
files - Max item Count:
5(limits the number of files processed)
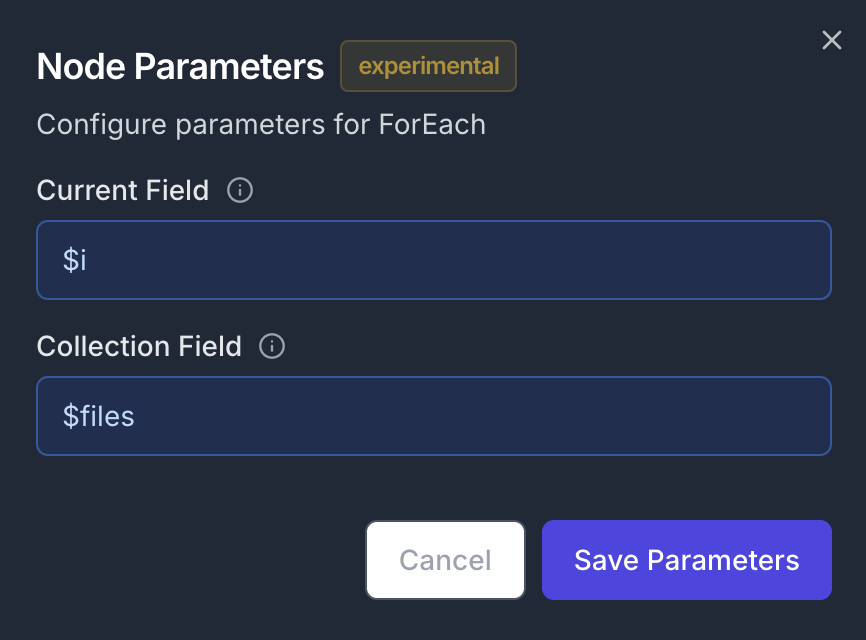
Step 3: Set Up ForEach Loop
Add a ForEach node to iterate through the file list and connect its first input to the previously created S3ListFiles node Node Configuration:- Parameters:
- Current Field:
$i(iterator variable name) - Collection field:
$files(references the output from S3ListFiles)
- Current Field:
Step 4: Load File Content
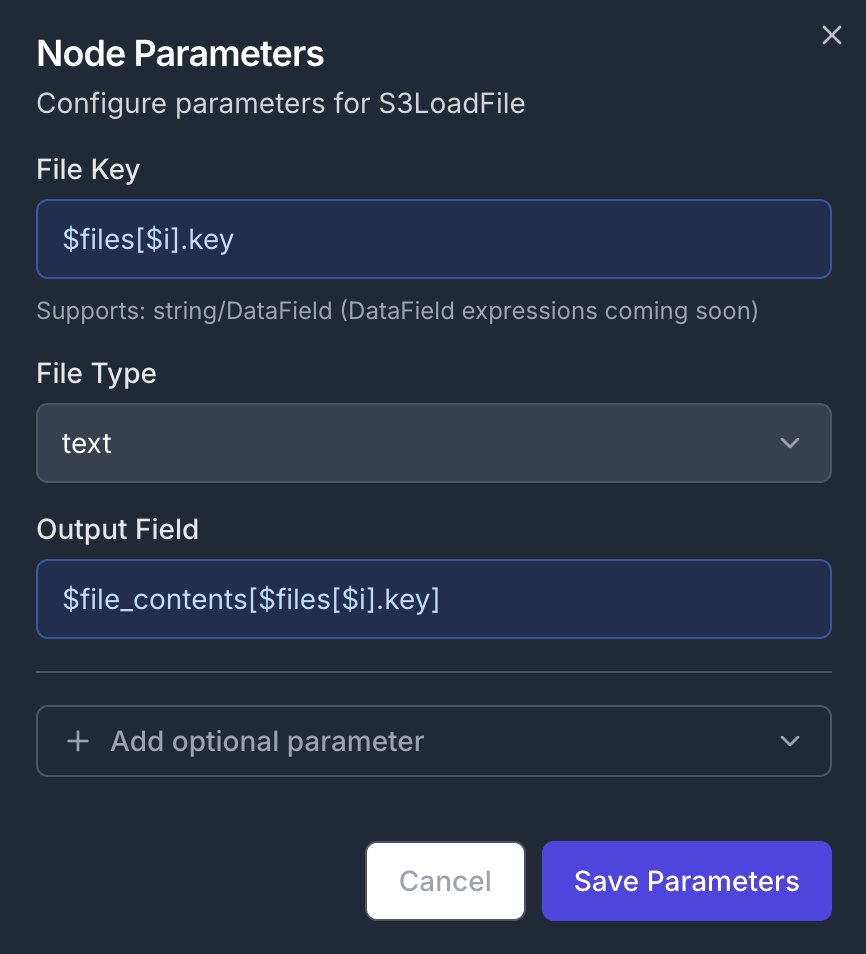
Add a new S3LoadFile node to the canvas, and connect its input to the first output of the previously created ForEach node. Node Configuration:- Parameters:
- Output Field:
$file_contents[$files[$i].key] - File Key (the name of the file):
$files[$i].key - File Type:
text
- Output Field:
$file_contents dict, using the name of the file ($files[$i].key) as the key
Step 5: Extract Entities with AI
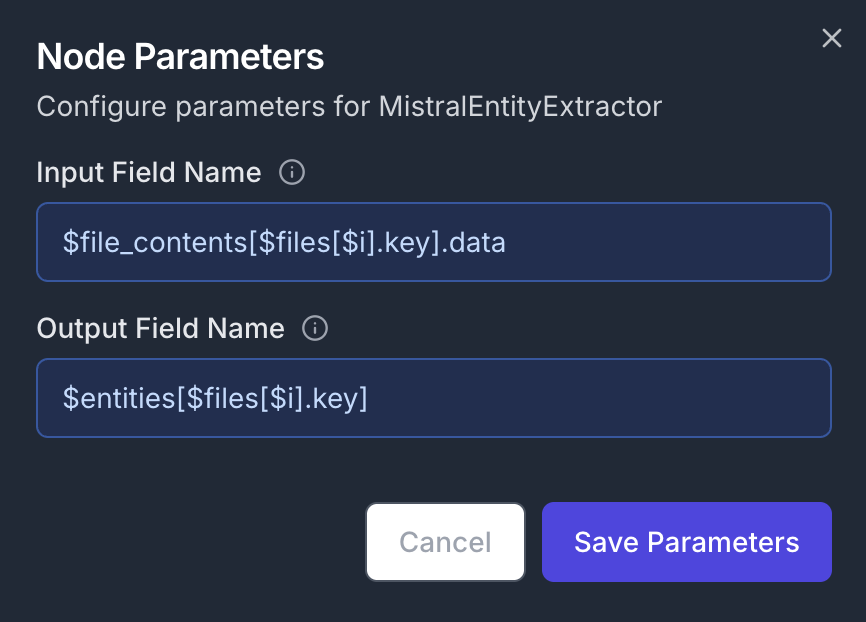
Add a MistralEntityExtractor node to analyze the current file’s content. Connect its input to the output of the previous S3LoadFile node. In order to close the ForEach loop, connect its output to the second input of the ForEach node. Node Configuration:- Parameters:
- Input Field Name:
$file_contents[$files[$i].key].data - Output Field Name:
$entities[$files[$i].key]
- Input Field Name:
$file_contents dict at the $files[$i].key key. The resulting entities are stored in a new $entities
Step 6: Merge All Entities
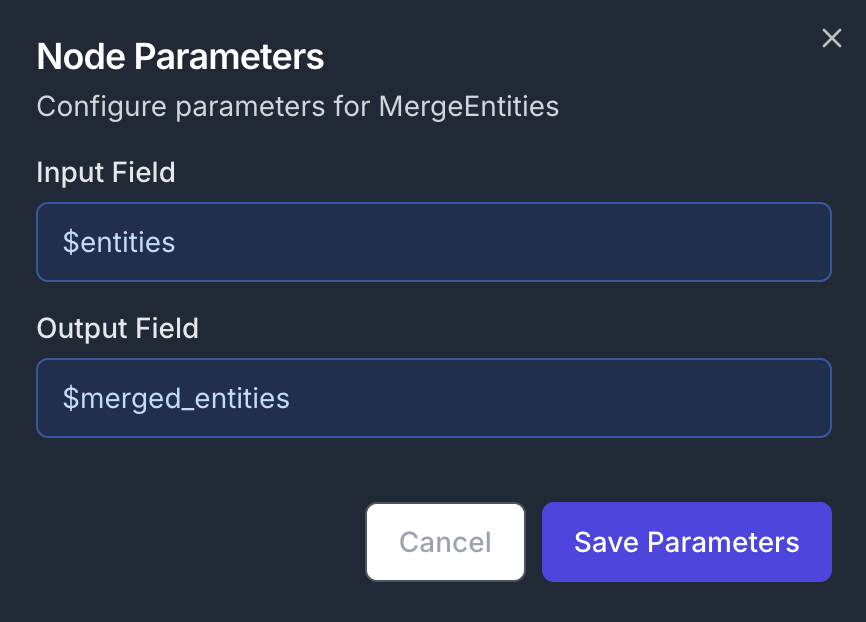
After the loop, the JSON data will contain a dict field$entities with key/value pairs corresponding to filename/extracted_entities. Thus, we now need to merge the entities into a single object. Add a MergeEntities node to the canvas and connect its input to the second output of the ForEach node. The node will be executed as soon as we exit out of the loop.
Node Configuration:
- Parameters:
- Input Field:
$entities - Output Field:
$merged_entities
- Input Field:
Step 7: Write to Database
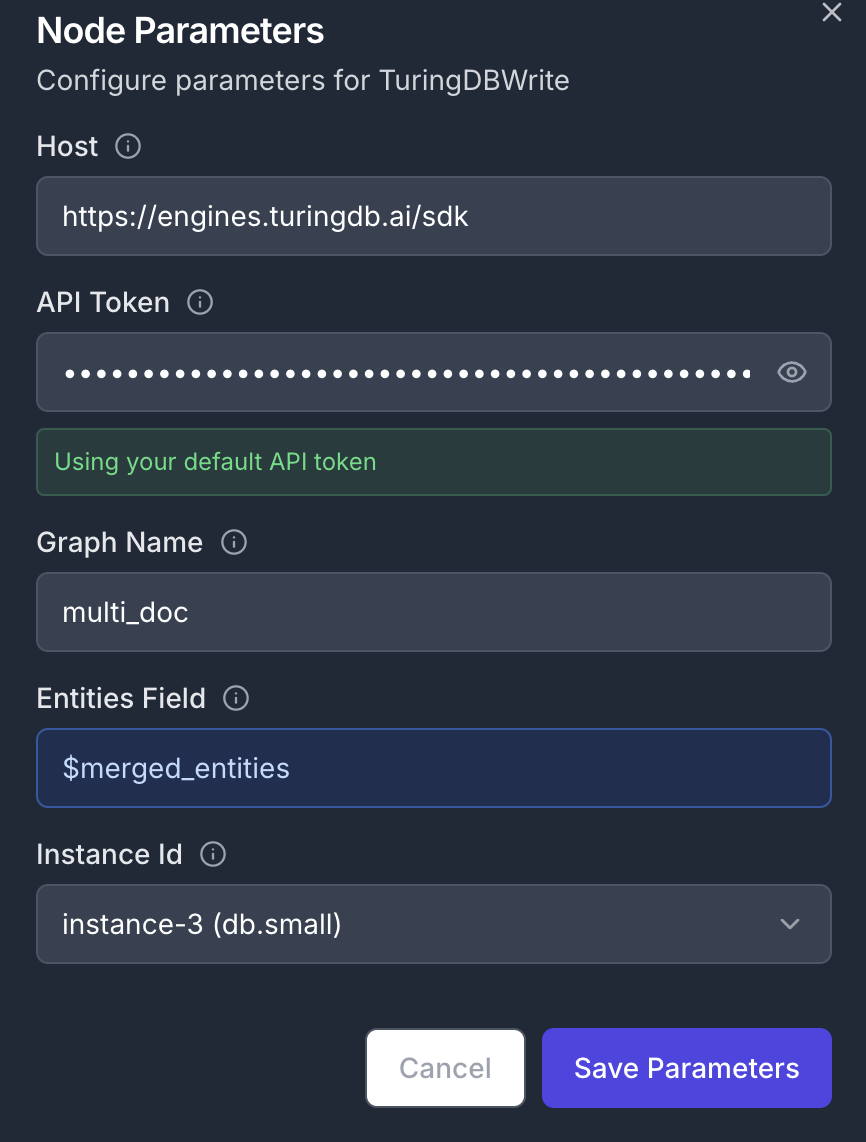
Add a TuringDBWrite node to create new graph containing the extracted entities. Connect the node’s input to the previous MergeEntities node’s output Node Configuration:- Parameters:
- Input Field:
$merged_entities - Graph Name:
multi_doc
- Input Field:
Step 8: Generate Graph Format
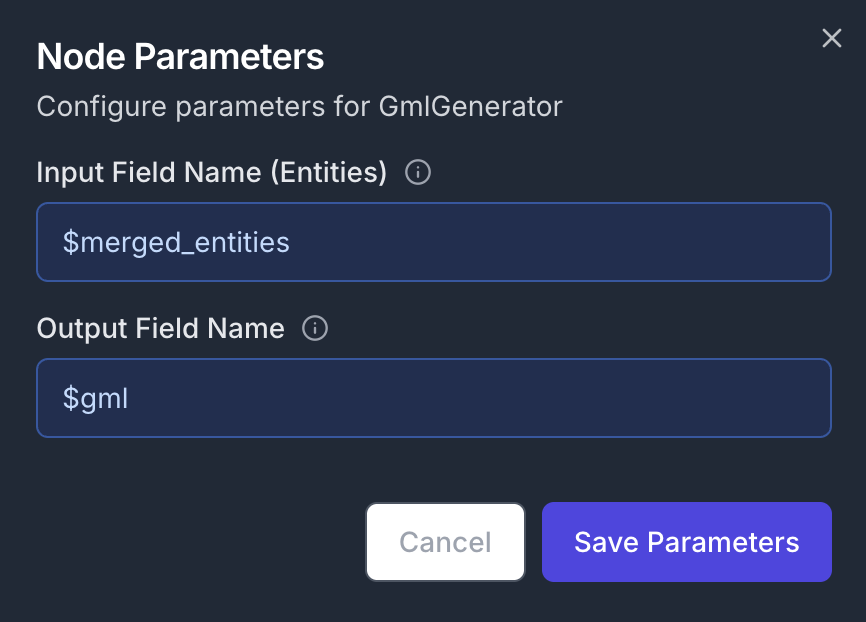
In parallel, we can generate agml file and ask an LLM to explain the structure of the graph. Add a GMLGenerator node to the canvas and connect its input to the MergeEntities node’s output.
Node Configuration:
- Parameters:
- Input Field Name:
$merged_entities - Output Field Name:
$gml
- Input Field Name:
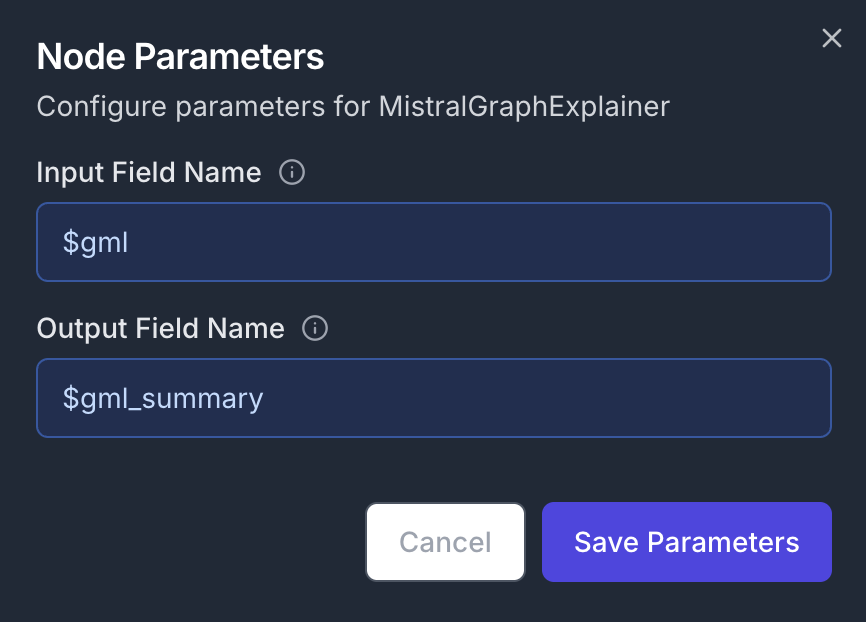
Step 9: Create AI Summary
Finally, add a MistralGraphExplainer node and connect its input to the GMLGenerator node’s output Node Configuration:- Parameters:
- Input Field Name:
$merged_entities - Output Field Name:
$gml
- Input Field Name:
Key Features Demonstrated
Data Field Operations
The workflow showcases advanced data field manipulation:- Append operations: Building collections over iterations
- Dynamic field access: Using
$files[$i].keyfor array indexing - Field chaining: Connecting data between multiple nodes
Loop Processing
The ForEach construct enables:- Iterative file processing
- Dynamic data collection
Parallel Processing
The workflow splits into two branches after entity merging:- Database storage path
- Visualization and summary path
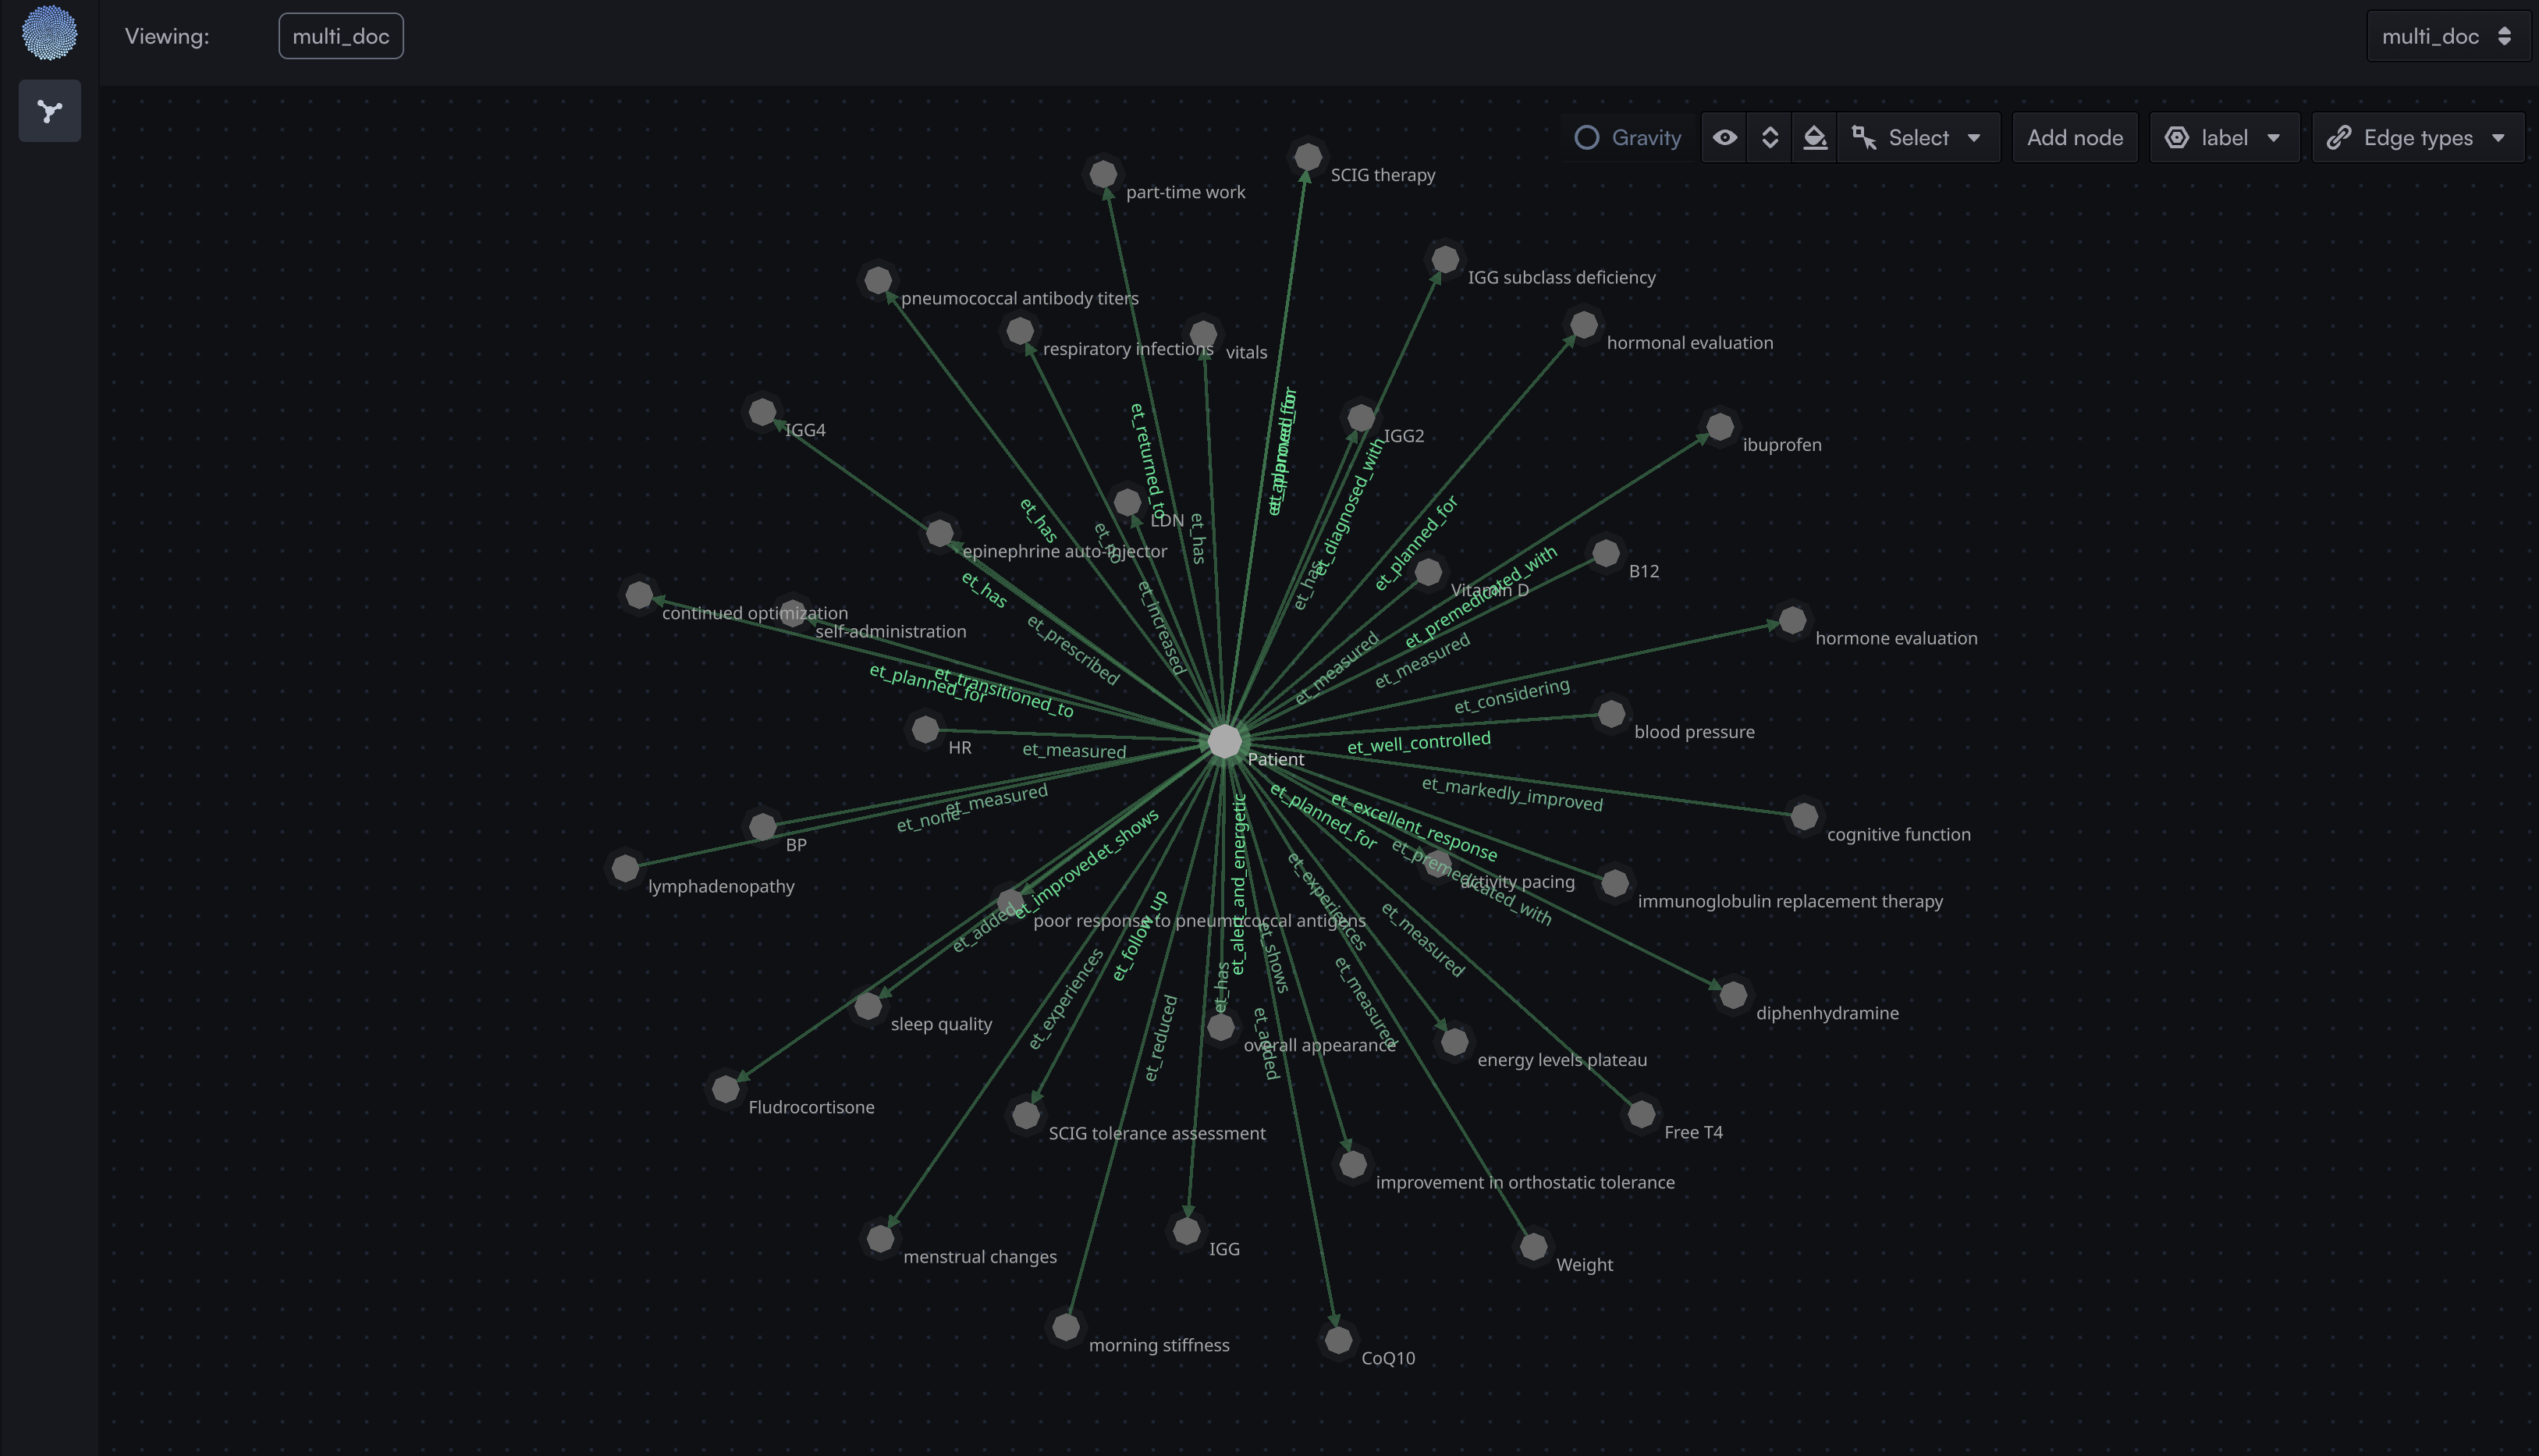
Expected Output
Upon completion, this workflow produces:- A populated TuringDB graph with extracted entities -> checkout the graph generated in Graph Visualiser of your TuringDB instance
- GML format representation suitable for graph visualization tools
- An AI-generated summary explaining the relationships and insights discovered in your data