Checkout the Github of the TuringDB Community Version If you want to support TuringDB leave us a star on Github !Documentation Index
Fetch the complete documentation index at: https://docs.turingdb.ai/llms.txt
Use this file to discover all available pages before exploring further.
Using Claude Code? Install the TuringDB skill once and let Claude handle the rest of this quickstart for you:Then in Claude Code run
/turingdb install turingdb and create a first graph. See the Claude Code Skill page for more.Create a Python project with TuringDB
The steps below walk you through setting up a Python project, installing the TuringDB SDK, and running your first graph.Install TuringDB Python SDK
Using or using the You can also install TuringDB using cmake: instructions on Github (link)
uv package manager:pip :Running TuringDB
If you want to launch TuringDB instantly in the CLIIf you want to launch TuringDB in the background as a daemonTo stop TuringDB running in the background:
Example to create and query a graph
Create graph → list graph → create node & create edge → commit → list graphs → match query
Python SDK
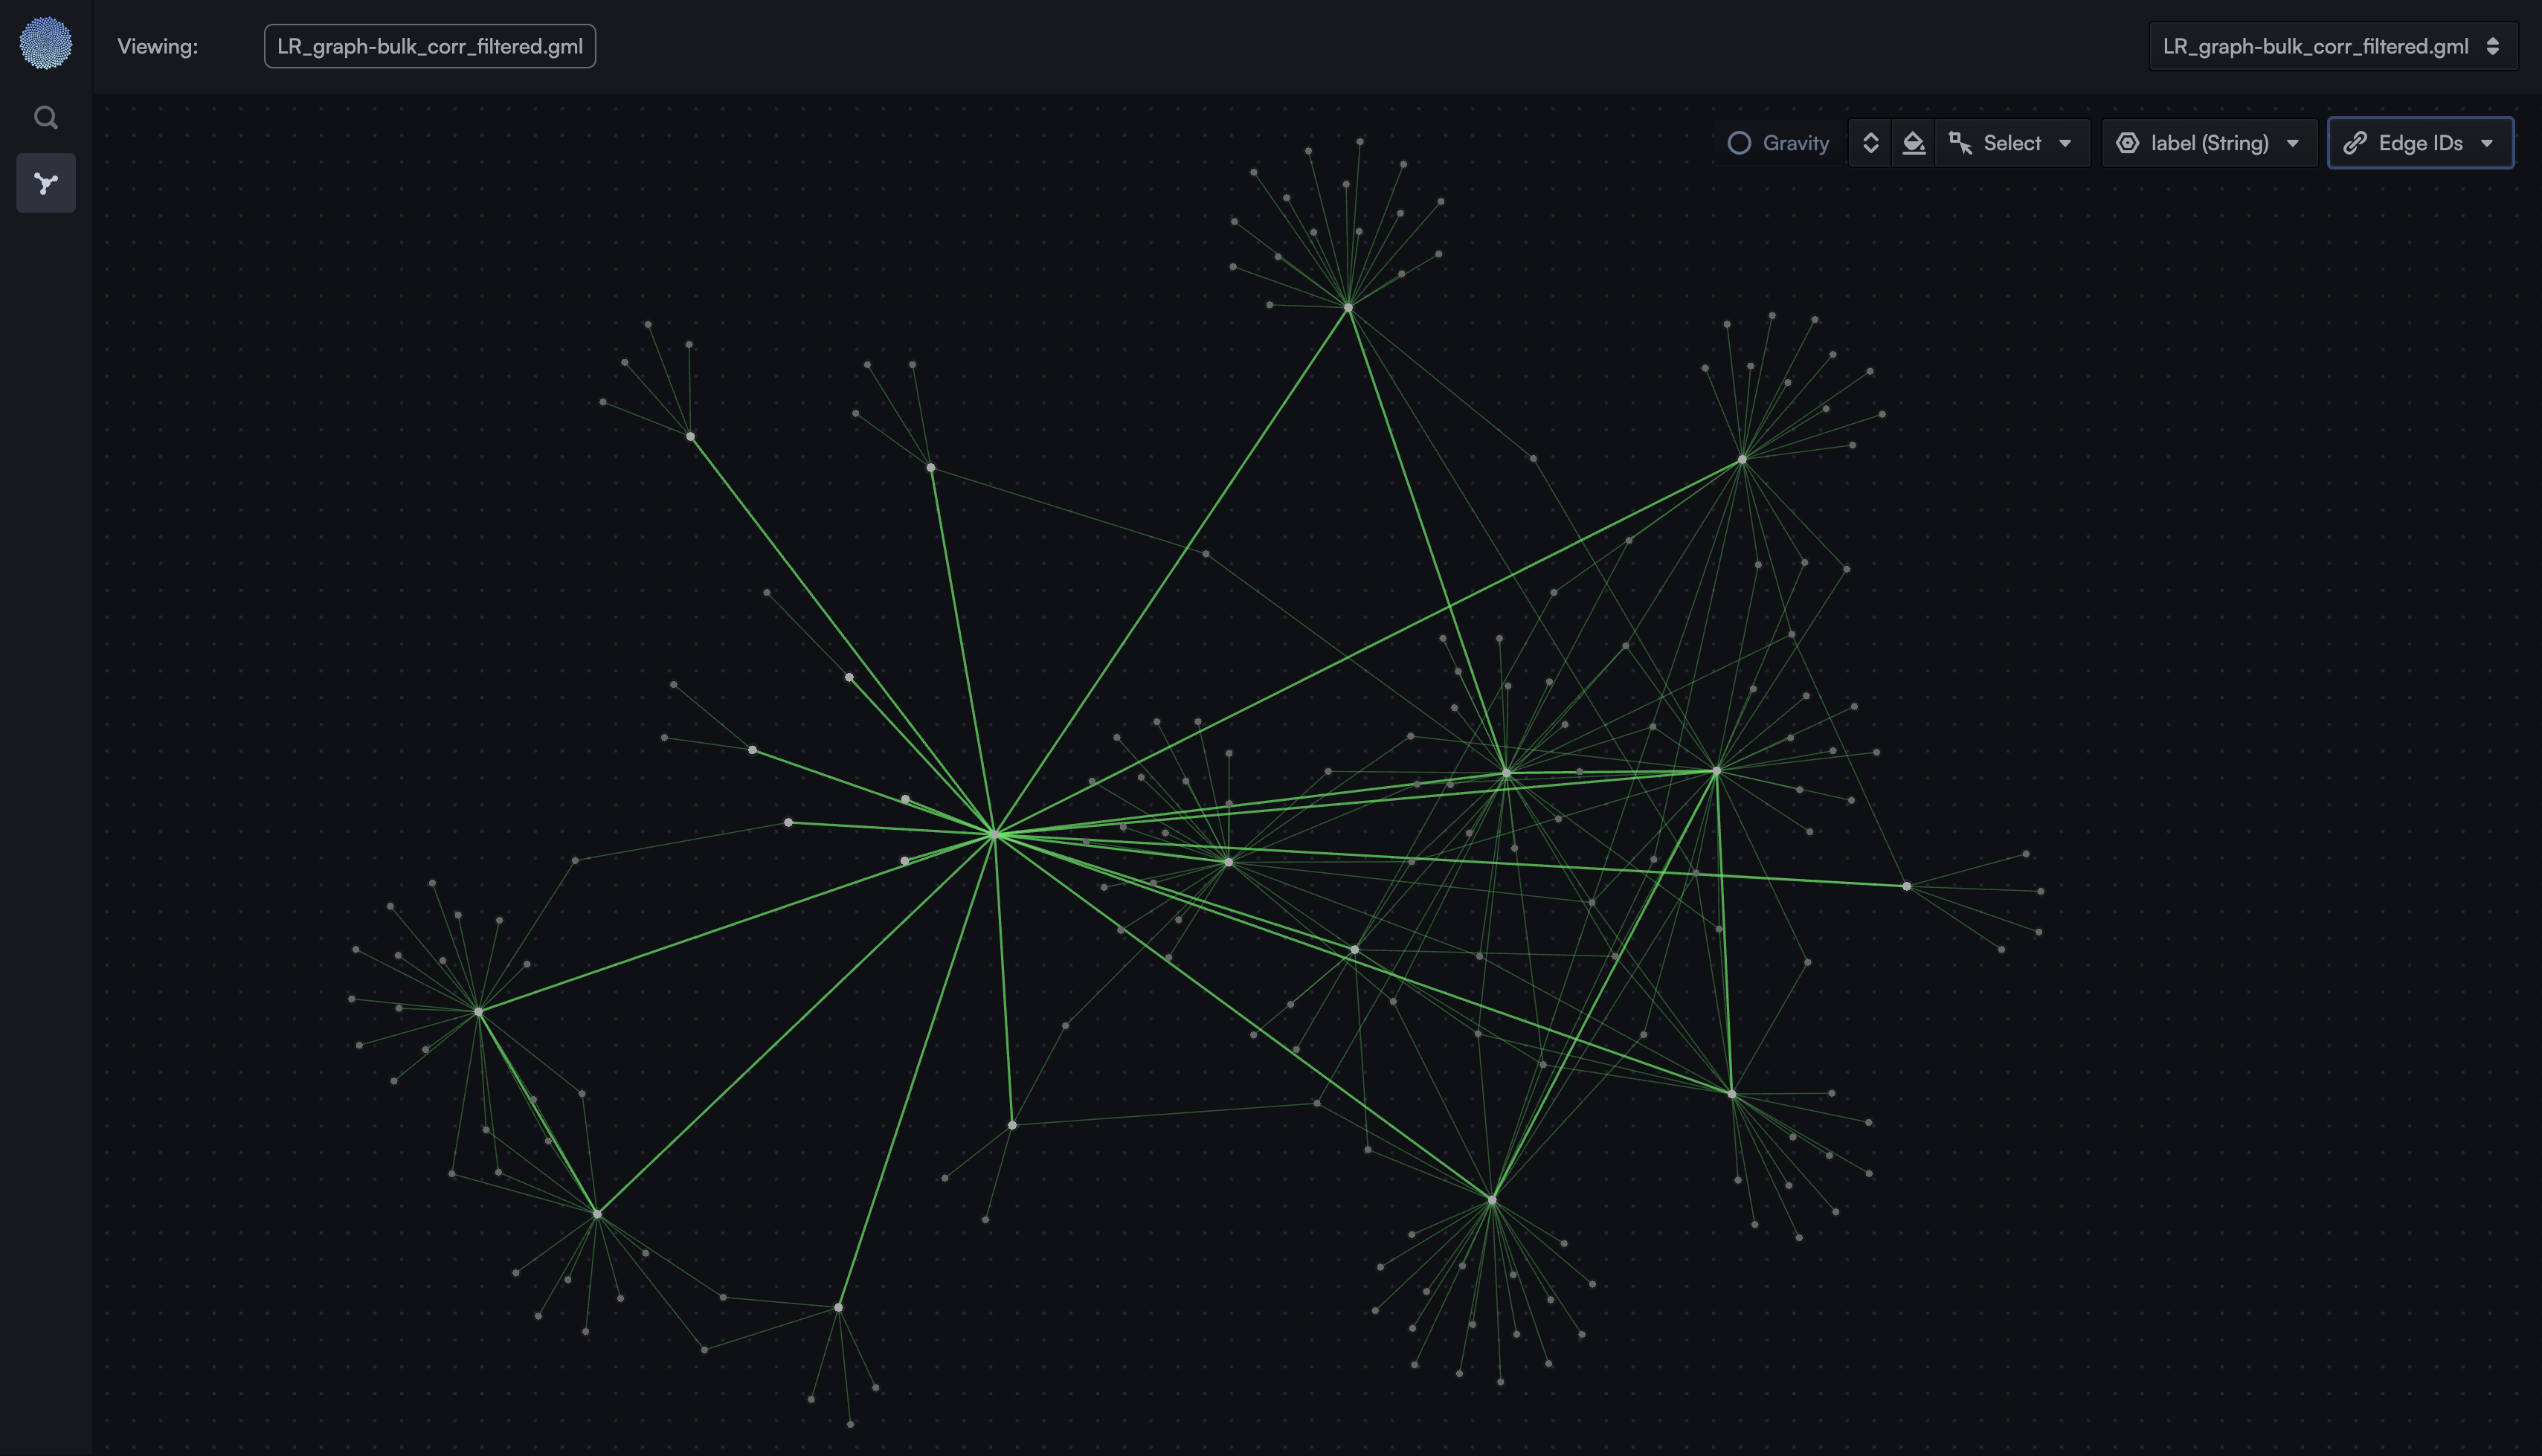
Visualise the graph you have created in TuringDB
TuringDB has a built-in visualiser to explore your graphs in the browser. Launch it with the Then open http://localhost:8080 in your browser.
-ui flag:Exploring your graph:
-
Launch the UI with
turingdb -ui - Choose on the top right the graph you want to explore
- Search a node of interest using the search tool or type a CYPHER query
-
Click on nodes to inspect nodes, double click to expand neighbors..etc.
You are done!